What Is Delivery Zone Optimization? A Complete Guide for Restaurants in 2026
A circle drawn around your restaurant treats every direction as equal. Traffic, rivers, highways, and demand are not. Optimization is the difference between a boundary that looks tidy on a map and one that actually protects your margin.
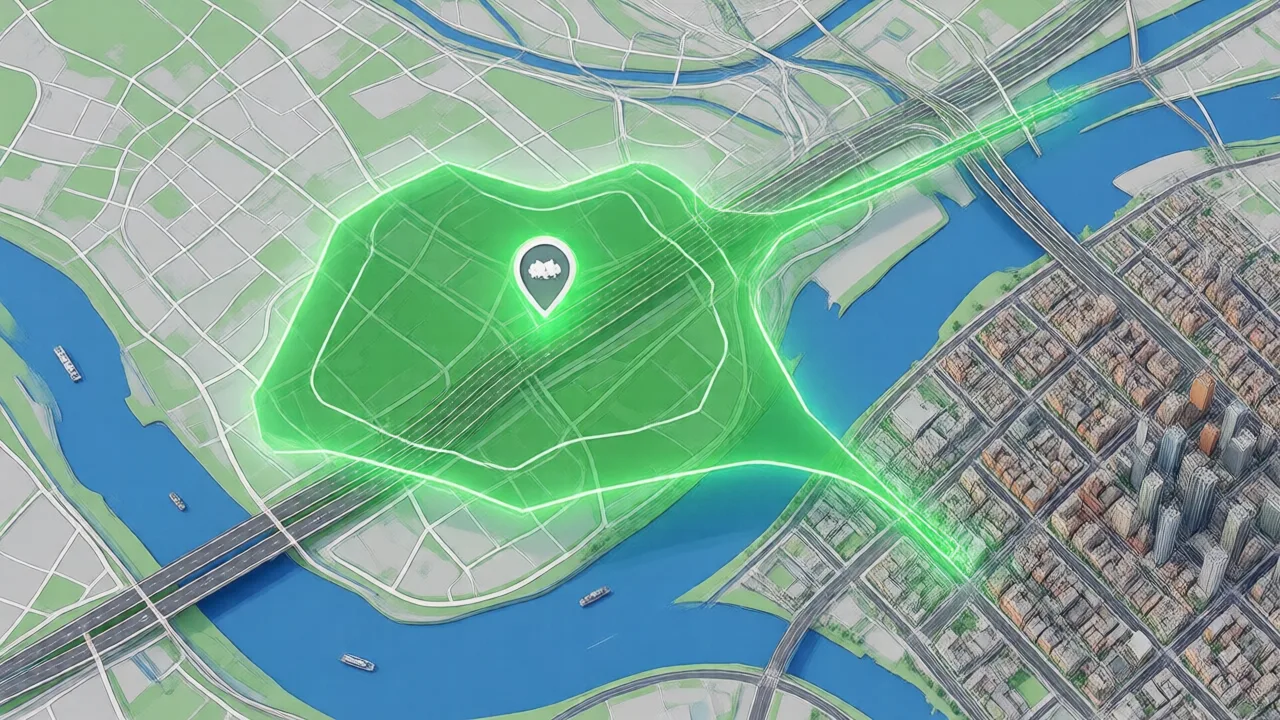
Ask most operators how far they deliver and you will get a number: three miles, five miles, "about ten minutes." That single number is drawn on the map as a circle, and the circle feels fair because it is symmetrical. The problem is that nothing about delivery is symmetrical. A driver heading north hits a highway on-ramp and covers four miles in seven minutes. The same driver heading south hits three traffic lights and a school zone and needs eleven minutes to cover two miles. The circle says those two orders are identical. Your food, your driver hours, and your margin say they are not.
That gap between the tidy circle and the messy reality is where money leaks. The order at the far edge arrives lukewarm and earns a one-star review. The driver who took it is off the road for forty minutes during your dinner rush, so two closer orders go out late behind it. And the fee you charged, if you charged one at all, covered maybe half of what that run actually cost. None of it shows up as a line item. It shows up as a delivery operation that feels busy but never quite makes money.
Delivery zone optimization is the fix, and it is less about software than about a shift in how you define the boundary in the first place. Let's break down what it actually is, how to do it, and the specific mistakes that keep a delivery program in the red.
What Delivery Zone Optimization Actually Means
Delivery zone optimization is the process of defining and continuously refining the area you deliver to based on the factors that determine whether an order arrives hot and turns a profit — drive time, the road network, demand density, and cost to serve — rather than a single distance measured from the front door.
The output is not a circle. It is an irregular polygon, sometimes several disconnected polygons, that bulges outward along arterial roads and highways where drivers move quickly, and contracts inward across congested grids, rivers, rail lines, and other barriers that slow the trip or force long detours. Two addresses that sit the same number of miles from your kitchen can end up on opposite sides of that boundary, and that is the entire point.
The word "continuously" matters as much as the map. A zone drawn once and forgotten is only correct on the day it was drawn. Traffic patterns shift by daypart, a new competitor opens and changes where you can win, a road closes for six months, and demand rises and falls with the season. Optimization treats the boundary as a living setting, not a permanent line.
Why a Circle Around Your Restaurant Is Costing You Money
Here is the uncomfortable math behind the tidy radius. Delivery cost is driven mostly by time, not distance — a driver's wage, the vehicle, and the opportunity cost of that driver not being available for the next order all accrue by the minute. Revenue per order, meanwhile, is roughly flat regardless of where the address sits. So as you push the boundary outward, cost climbs steadily while revenue stays put, and somewhere along that line every order past it loses money.
A circle guarantees that some of your map sits past that line. Because the boundary is set by distance alone, the slow directions are extended to match the fast ones. You end up serving the eleven-minute, three-traffic-light addresses simply because they happen to fall within the same mileage as the seven-minute highway addresses. Those are precisely the orders that arrive cold, tie up drivers, and quietly erase the profit from three good orders each.
The same logic explains why reducing delivery time and optimizing the zone are two halves of one strategy: a tighter, smarter boundary is one of the biggest levers on average delivery time, and shorter times protect both food quality and driver throughput.
The Four Inputs That Define a Profitable Zone
Optimization replaces the one input of a radius (distance) with four. Each one bends the boundary in a different way.
| Input | What it measures | How it bends the zone |
|---|---|---|
| Drive time | Real minutes door-to-door, by direction and daypart | Extends along fast roads, contracts across slow grids |
| Road network & barriers | Highways, one-ways, rivers, rail lines, gated areas | Cuts out pockets that require long detours to reach |
| Demand density | Order volume per neighborhood | Justifies reaching further where enough orders cluster |
| Cost to serve vs. margin | Driver cost per run against per-order profit | Sets the hard edge where an order stops paying for itself |
Notice that drive time and cost to serve do most of the work, while the road network and demand density decide the exceptions — the finger of coverage you extend along a highway because the drive is fast and the orders are there, or the notch you carve out of an otherwise-covered neighborhood because a river forces a six-minute detour to a bridge. Getting the boundary right starts with measuring the drive, which is exactly what a delivery radius calculator is built to help you do before you commit a shape to the map.
How to Optimize Your Delivery Zone: A Step-by-Step Method
You do not need a data science team to do this well. You need your own order history and a disciplined pass through five steps.
- Map your last 90 days of deliveries. Plot every delivered order by address, and attach its actual door-to-door time and its contribution margin after driver cost. This single view usually reveals a cluster of profitable orders and a scatter of money-losers on the fringe.
- Find your profit edge in minutes, not miles. Sort orders by drive time and watch where margin turns negative. For most operators the edge falls somewhere in the 10-to-15-minute drive range, but yours is yours — read it off your own data rather than copying a competitor.
- Draw the zone by direction. Apply that time threshold along each major road out of your restaurant. The boundary will stretch where roads are fast and pull in where they are slow, and it will not look like a circle. That asymmetry is correct.
- Cut the barriers and dead zones. Remove pockets that require long detours, sit across a natural barrier, or generate almost no orders. Coverage you never use still forces your fee and promise-time math to account for it.
- Set fees to the zone, then re-measure. Where you keep a longer-drive area, price it with a distance- or zone-based fee that covers the true cost. Then review the results monthly and adjust, because the first draft is a hypothesis, not a monument.
Two practical notes. First, do this per daypart if your traffic swings hard between lunch and dinner — the honest evening zone is almost always smaller than the lunch one. Second, keep the map legible to your team: dispatchers and drivers should be able to see the zone and the reasoning, not just be handed a boundary. The same order data that drives this exercise is the backbone of good driver management, and the two improve together.
Example scenario: a two-unit Indian restaurant with a flat four-mile radius
Illustrative scenario — a composite example built to show how the numbers work. It does not describe a real business or customer.
Consider a two-unit Indian restaurant in Columbus, OH that runs a flat four-mile radius across both locations because it is the number the previous owner used. Delivery volume is healthy, but the delivery P&L never gets out of the low single digits, and complaints about cold food cluster oddly on the west side of one store.
Suppose the owner plots 90 days of orders against actual drive time and driver cost, and the pattern is stark. To the east, a four-mile order rides a parkway and arrives in nine minutes. To the west, the same four miles cross a river and a downtown grid, taking sixteen to nineteen minutes — and every one of those west-side orders is losing $2 to $4 after driver cost. Roughly 14% of deliveries are sitting past the profit edge, and they generate a disproportionate share of the cold-food reviews.
She redraws the boundary by direction: extends coverage east along the parkway to nearly six miles, pulls the western edge back to the near side of the river, and adds a modest distance-based fee on the longer runs that remain. She keeps a short list of loyal west-side regulars on a manual exception rather than cutting them cold.
Over the next quarter, average delivery time drops from 27 minutes to 21, cold-food complaints on that store fall by more than half, and the delivery contribution margin roughly doubles — not by delivering more, but by no longer delivering the orders that never made money. A bigger circle did not mean more business in this example. It just meant more of the business the restaurant was losing on.
Static Zones vs. Dynamic Zones
Everything above describes a static optimized zone: a smarter, hand-drawn boundary you review on a schedule. That alone puts you ahead of most operators. The next step is a dynamic zone that adjusts in real time to conditions on the ground.
A dynamic zone tightens automatically when your drivers are all out and the kitchen is backed up, so you stop accepting distant orders you cannot fulfill on time, and it reopens when capacity frees up. It can also flex with live traffic, shrinking during a rush-hour jam and expanding late at night when roads are clear. The goal is the same — keep every accepted order inside the profit-and-quality edge — but the boundary now responds by the minute instead of by the quarter. This kind of load-aware boundary is easiest when your zone, your dispatch, and your order flow all live in one system rather than in three tools that do not talk to each other. If you are still weighing who should own the delivery in the first place, our breakdown of in-house delivery vs. third-party apps is the right companion read, because the answer changes how much control you have over the zone at all.
Want to see the profit edge before you draw the line? Learn how KwickOS handles delivery zones, fees, and drive-time boundaries — and model a run with the free delivery fee calculator to see where an order stops paying for itself.
Learn more about delivery on KwickOS →Common Delivery Zone Mistakes to Design Out
- Using a circle at all. A radius is a distance setting pretending to be a strategy. It over-serves your slow directions by definition.
- Measuring in miles instead of minutes. Miles are what the map shows; minutes are what your cost and your food quality actually track.
- One zone for every daypart. The boundary that works at 2 p.m. is usually underwater at 7 p.m. Split it.
- Chasing coverage for its own sake. A bigger zone is not a bigger business if the marginal orders lose money. Reach is not revenue.
- Setting it once and forgetting it. Roads, competitors, and demand move the profitable edge. An unreviewed zone is drifting out of date every month.
- Fixing everything with fees. Fees recover cost on exceptions; they cannot rescue a boundary that is structurally too big.
Frequently Asked Questions
What is delivery zone optimization?
Delivery zone optimization is the practice of defining the geographic area you will deliver to based on drive time, road network, demand density, and per-order profit rather than a fixed distance from the store. Instead of a circle, the optimized zone becomes an irregular shape that reaches further along fast roads, pulls back where traffic or barriers slow drivers down, and excludes pockets where the cost to serve exceeds the margin on a typical order.
What is the difference between a delivery radius and a delivery zone?
A delivery radius is a single distance drawn as a circle around the restaurant, so it treats every direction as equal. A delivery zone is a shape drawn around real conditions, so it can extend eight minutes along a highway in one direction and stop at four minutes across a congested grid in another. The radius is simpler to set up; the zone reflects what actually determines whether an order arrives hot and profitable.
How far should a restaurant deliver?
Measure in minutes, not miles. Most restaurants find that food quality and delivery economics both hold up to roughly a 20 to 30 minute total order-to-door time, of which the drive itself is often capped near 10 to 15 minutes. The exact boundary depends on your food's tolerance for transit, your driver model, and your fee structure, which is why the right distance varies by direction and by daypart rather than being one number.
Do delivery fees fix an unprofitable zone?
Only partly. A distance-based or zone-based delivery fee can recover cost on the edge of the map, but a fee high enough to make a distant order profitable is often high enough to kill the order entirely. Optimization works the other side of the equation by shrinking the number of high-cost deliveries in the first place, so fees are covering exceptions rather than subsidizing a structurally money-losing radius.
How often should delivery zones be reviewed?
Review the zone at least quarterly, and separately for major dayparts if your traffic patterns shift, because a boundary that works at 2 p.m. can be underwater during the evening rush. Road changes, new competitors, and seasonal demand all move the profitable edge. Operators using dynamic zones let the system tighten the boundary automatically during peak load and reopen it when drivers are available.
Become a KwickOS Reseller
POS dealers and restaurant technology consultants: add KwickOS and KwickSpot to your portfolio. Give your clients drive-time delivery zones, load-aware boundaries, and delivery P&L they can actually read — and earn recurring revenue on every account.
Learn About the Reseller ProgramKwickOS Ecosystem
© 2024-2026 KwickOS. All rights reserved.