What Is a Delivery SLA? Setting Promise Times You Can Keep
The number you put on the confirmation screen is a contract. Here is how to build one out of your own kitchen and drive-time data, and how to defend it on the nights that try to break it.
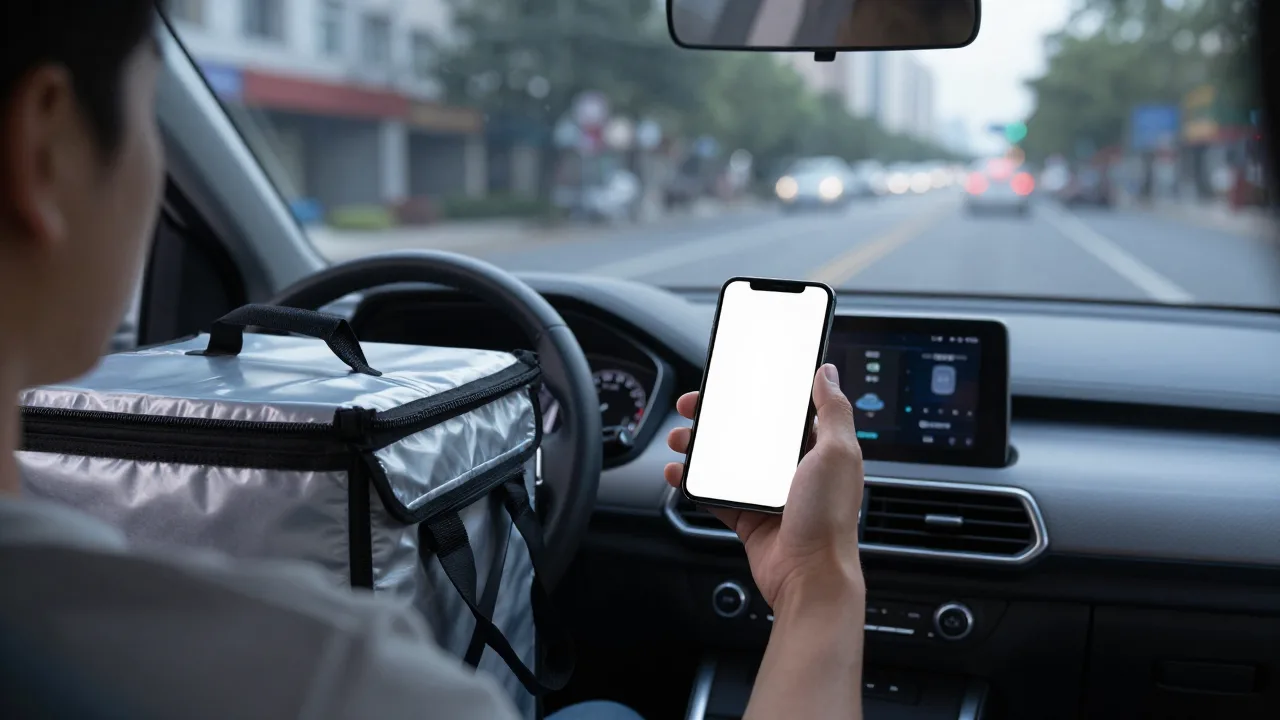
Every delivery order carries a number the guest treats as a promise. It appears on the confirmation screen, in the text message, on the tracking page, and it is the one thing the guest measures you against for the next hour. Most restaurants pick that number the way you pick a lottery ticket. Forty-five minutes sounds right. It has sounded right since 2019.
A delivery SLA replaces the guess. Borrowed from software and logistics, a service level agreement is a stated commitment: this is the window, this is how often we hit it, and this is what you get when we do not. Applied to a restaurant, it forces three questions a quoted time lets you avoid.
The Three Parts of a Real Delivery SLA
Plenty of operators think they already have an SLA because their online ordering page shows an estimate. An estimate is one third of the job. A working SLA has all three of these components, written down, and known to every person on the schedule.
1. The Window
Not a single minute, a window. "40–55 minutes" rather than "45 minutes." A single number is a promise you break in both directions, since a guest who planned around 45 minutes is annoyed at 52 and confused at 33 when the food arrives before they finish the call they stepped away to take. A window sets an expectation with a defined edge, and the edge is what people actually judge you against.
2. The Hit Rate
What percentage of orders must land inside the window? Ninety to ninety-five percent is the working target for in-house delivery. Below 85%, the volume of refund requests and one-star reviews starts eating the margin that made delivery worth doing. Above 97%, you are almost certainly padding the window so heavily that a competitor quoting 35 minutes is taking orders you should have won.
3. The Remedy
What happens on a miss. This is the part almost nobody writes down, which is why misses get handled five different ways by five different shift leads. A remedy can be modest — a 20% credit, a free appetizer next visit — but it has to be defined, funded, and authorized at the shift level so nobody has to call the owner at 8:40 on a Friday.
Your promise time should come from your data, not your memory. KwickSpot runs on KwickOS, tying ticket times, dispatch queue, and real drive times into one view so the window you quote is the window you can actually hold.
Start your free trial — no credit card needed →Where the Minutes Actually Go
Ask an operator why a delivery ran late and you will usually hear "the driver got stuck." Pull the timestamps and you will usually find the driver was the shortest segment. A delivery is four clocks running in sequence, and the two in the middle are where the damage happens.
| Segment | Typical median | Typical 90th percentile | Who controls it |
|---|---|---|---|
| Ticket time (order to bagged) | 13 min | 26 min | Kitchen |
| Dispatch wait (bagged to driver leaves) | 4 min | 17 min | Dispatch / staffing |
| Drive time (store to address) | 11 min | 19 min | Zone design, traffic |
| Handoff (arrival to delivered) | 2 min | 6 min | Address quality, building access |
Notice what the 90th percentile column does. Median to median, this store delivers in 30 minutes. On the worst one night in ten — which is to say every Friday and Saturday, the nights that produce most of your reviews — the same store needs 68. If you set your promise from the median, you have designed a system that fails precisely when the most people are watching.
Here is the part that surprises people: dispatch wait has the widest spread of any segment. Food sitting on the expo shelf waiting for a driver to come back is pure, invisible loss. It ages the food and burns the clock at the same time. Most operators never measure it because no POS reports it by default, and the fix — one more driver on the road between 6:15 and 8:00 — usually costs less than the refunds it prevents. A dedicated driver dispatch app that stamps the departure automatically is the cheapest way to start seeing that number at all.
Building Your Window in Six Steps
You can do this with a spreadsheet and two weeks of order data. It takes an afternoon and it will change what you quote by Monday.
Step 1: Pull 14 Days of Timestamps
You need order placed, order ready, driver departed, and delivered, per order. If any of those four is missing from your system, that gap is your first project, because you cannot manage a clock you do not record. Even a manual log kept for two weeks beats guessing.
Step 2: Calculate Percentiles, Not Averages
For each segment, get the median and the 90th percentile. The average will sit somewhere between and mislead you in both directions. Averages are what make operators say "we're a 30-minute store" while their guests experience a 50-minute store twice a week.
Step 3: Split by Daypart and Zone
A Tuesday 2 p.m. order and a Friday 7 p.m. order to the same address are different products. Split your data at least into weekday lunch, weekday dinner, and weekend dinner. If you deliver to more than one zone, split by zone too, since a well-designed set of boundaries makes the drive-time column predictable. That is the whole argument for careful delivery zone optimization: it converts a random variable into a known one.
Step 4: Add the Segments at P90, Then Subtract Overlap
Sum the 90th percentile of each segment, then trim 10 to 15% because the segments rarely all go wrong on the same ticket. In the table above, 26 + 17 + 19 + 6 = 68, trimmed to roughly 58. That is your realistic upper edge for a weekend dinner order.
Step 5: Set the Window 12 to 15 Minutes Wide
Working backward from 58, a weekend dinner window of 45–58 minutes is honest. Weekday lunch, with a shorter queue and lighter traffic, might be 28–40. Publishing different windows by daypart feels fussy until you realize you are already delivering different products at different times, and the guest can see the difference even when your ordering page cannot.
Step 6: Instrument the Miss
Set a trigger at 80% of the window's upper edge. On a 45–58 minute quote, that is minute 46. If the order has not been delivered by then, the system should tell someone. A proactive text at minute 46 saying "running a few minutes behind, we now expect 8:12" costs nothing and consistently outperforms silence. The same message at minute 70 arrives after the guest has already decided how they feel.
Example scenario: a two-unit Indian kitchen quoting 45 minutes because it always had
Illustrative scenario — a composite example built to show how the numbers work. It does not describe a real business or customer.
Consider a two-unit Indian kitchen in Sacramento whose stores quote 45 minutes because that is what the previous owner quoted. Delivery complaints run about 6% of orders, and refunds cost roughly $2,900 a month across the two locations. The owner's instinct is that more drivers are needed.
Before hiring, suppose she pulls three weeks of timestamps. The drive segment is fine: 12-minute median, 18 at the 90th percentile. Ticket time is fine at lunch and ugly at dinner, 15 median and 29 at P90. But the number that stops her is dispatch wait on Friday and Saturday between 6:30 and 8:15 — a 21-minute 90th percentile. Bagged food is sitting on a shelf for a third of an hour while every driver is out.
She makes two changes. First, one driver's shift start moves from 5 p.m. to 4:30 and a four-hour Friday and Saturday driver is added from 6 to 10 p.m., costing about $340 a week. Second, the quoted time changes from a flat 45 minutes to three windows: 30–42 at lunch, 38–50 weeknight dinner, 45–58 weekend dinner.
Ninety days later, on-time performance against the quoted window is 93%, up from an effective 71% against the old flat number. Refunds fall to about $700 a month. The window that looks slower on the website actually makes people happier. In this example the restaurant stopped promising something it only delivered on Tuesdays.
The Objection: Won't a Longer Window Cost Me Orders?
This is the fear that keeps bad numbers on ordering pages for years, and it deserves a straight answer. Yes, quoted time influences conversion. No, the influence is not big enough to justify a promise you break one time in three.
Consider what a broken promise costs. A late order generates a support contact roughly 40% of the time, and a refund or credit maybe half of those. A guest whose first delivery from you arrives 20 minutes late orders again at a markedly lower rate than one whose order arrives on time, which is the whole reason delivery retention economics hinge more on reliability than on speed. You are trading a small conversion bump today against repeat frequency for a year.
There is also a middle path worth taking seriously: shorten the actual delivery instead of the quote. Most stores have 8 to 12 minutes of recoverable time sitting in prep sequencing, expo staging, and dispatch batching. Working through the standard levers for reducing restaurant delivery time lets you compress the real clock, then tighten the window from a position of evidence rather than hope. Zone design matters here too, and the tradeoffs in setting a delivery radius that stays profitable are the same tradeoffs that decide whether your drive-time segment is predictable.
Measuring It Without Building a Dashboard Nobody Reads
Four numbers, reviewed weekly, cover almost everything worth knowing:
- On-time rate against the quoted window. Not against dispatch, not against "when the kitchen finished." Against what the guest was told.
- P90 total time by daypart. When this drifts up, your window is about to stop being true.
- Dispatch wait. The most actionable and most ignored number in the whole delivery operation.
- Breach cost. Refunds plus credits plus comped items on late orders, expressed as a percentage of delivery revenue. If it is above 2%, the SLA is fiction.
These four sit alongside the broader set of delivery metrics and KPIs you already track, and they are the ones that change decisions. The per-stage timestamps that make them possible also power a working order tracking experience for guests, so one investment pays twice.
Tiering the SLA Instead of Averaging It
Once your window is real, the next move is to stop having one. A single SLA across all conditions forces you to price the worst case into every order. Operators who tier get both accuracy and speed:
- By zone. Zone A, inside a seven-minute drive, might promise 30–42. Zone C, at the edge, promises 50–65 and carries a higher delivery fee.
- By daypart. Lunch and weekend dinner are different operations. Quote them differently.
- By order size. Above roughly a dozen items, switch to a scheduled arrival time instead of a window.
- By weather and known events. A one-touch "surge mode" that adds 12 minutes to every quote is one of the cheapest operational features you can build, and it saves the shift lead from making the call ticket by ticket.
Tiering also gives you a clean answer for peak nights. Rather than pretending Friday at 7 p.m. behaves like Tuesday at 2, you plan for it — which is the core of good peak hour delivery management — and the quoted window tells the truth about the tradeoff instead of hiding it until the food is cold.
Stop apologizing for a number you invented. KwickSpot on the KwickOS platform builds promise windows from live ticket, dispatch, and drive data, flags at-risk orders before the guest notices, and shows on-time performance by zone and daypart.
Join 5,000+ restaurants — get started free →Mistakes That Quietly Break an SLA
- Measuring from dispatch instead of order placement. The guest's clock starts when they hit submit. Any measurement that starts later is grading yourself on a different exam.
- One flat window all day. It is simultaneously too slow at lunch and too fast on Saturday, so it loses orders and breaks promises in the same week.
- Letting third-party marketplace times set the internal standard. Marketplace estimates are built for their conversion funnel, not your kitchen. Track your own.
- No trigger before the breach. A late notification that arrives after the guest has already texted you is not communication, it is confirmation.
- Never re-baselining. Menu changes, a new zone, a lost driver, and a road construction project all move the numbers. Re-pull the percentiles quarterly.
The through-line: an SLA is an operating standard, not a marketing number. Once the window comes from data, a miss stops being an argument between the kitchen and the drivers and becomes a fixable segment on a specific shift.
Frequently Asked Questions
What is a delivery SLA for a restaurant?
A delivery SLA is a service level agreement that states the time window you promise a guest their order will arrive in, plus the on-time percentage you commit to hitting and what happens when you miss. In practice it is three numbers: the quoted window, the target hit rate, and the remedy. Without all three, you have a guess, not an SLA.
What is a good on-time delivery rate?
Aim for 90 to 95 percent of orders arriving inside the quoted window, measured against the time the guest was told, not the time you dispatched. Anything below 85 percent generates enough refund requests and one-star reviews to erode delivery margin. Above 97 percent usually means the quoted window is padded so heavily that you are losing orders to faster competitors.
How do I calculate a realistic delivery promise time?
Add your ticket time, dispatch queue wait, drive time to the zone, and handoff time, then use the 90th percentile of each rather than the average. Averages hide the bad nights that generate complaints. A kitchen averaging 14 minutes with a 90th percentile of 26 should build the promise on 26, not 14, and then quote a window rather than a single minute.
Should I quote a single time or a time range?
Quote a range of 10 to 15 minutes. A single number is a promise you break by definition, since arriving two minutes early or late both count as wrong. A range like 40 to 55 minutes reads as honest, gives dispatch room to batch orders, and research on delivery expectations consistently shows guests judge lateness against the end of the window, not the middle.
What should happen when a delivery misses its SLA?
Notify the guest before they notice, name a new arrival time, and attach a remedy that costs less than a lost customer, typically a credit of 15 to 25 percent of the ticket or a free item on the next order. A proactive text sent at minute 45 of a 40 to 55 minute window converts a complaint into goodwill. The same message sent at minute 70 does not.
Become a KwickOS Reseller
POS dealers and restaurant technology consultants: add KwickOS and KwickSpot to your portfolio. Give your clients delivery SLAs built on real timestamps instead of guesswork, and earn recurring revenue on every account.
Learn About the Reseller ProgramKwickOS Ecosystem
© 2024-2026 KwickOS. All rights reserved.